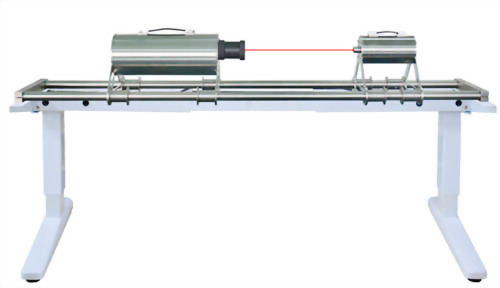
Nano particle size and Zeta analyzer
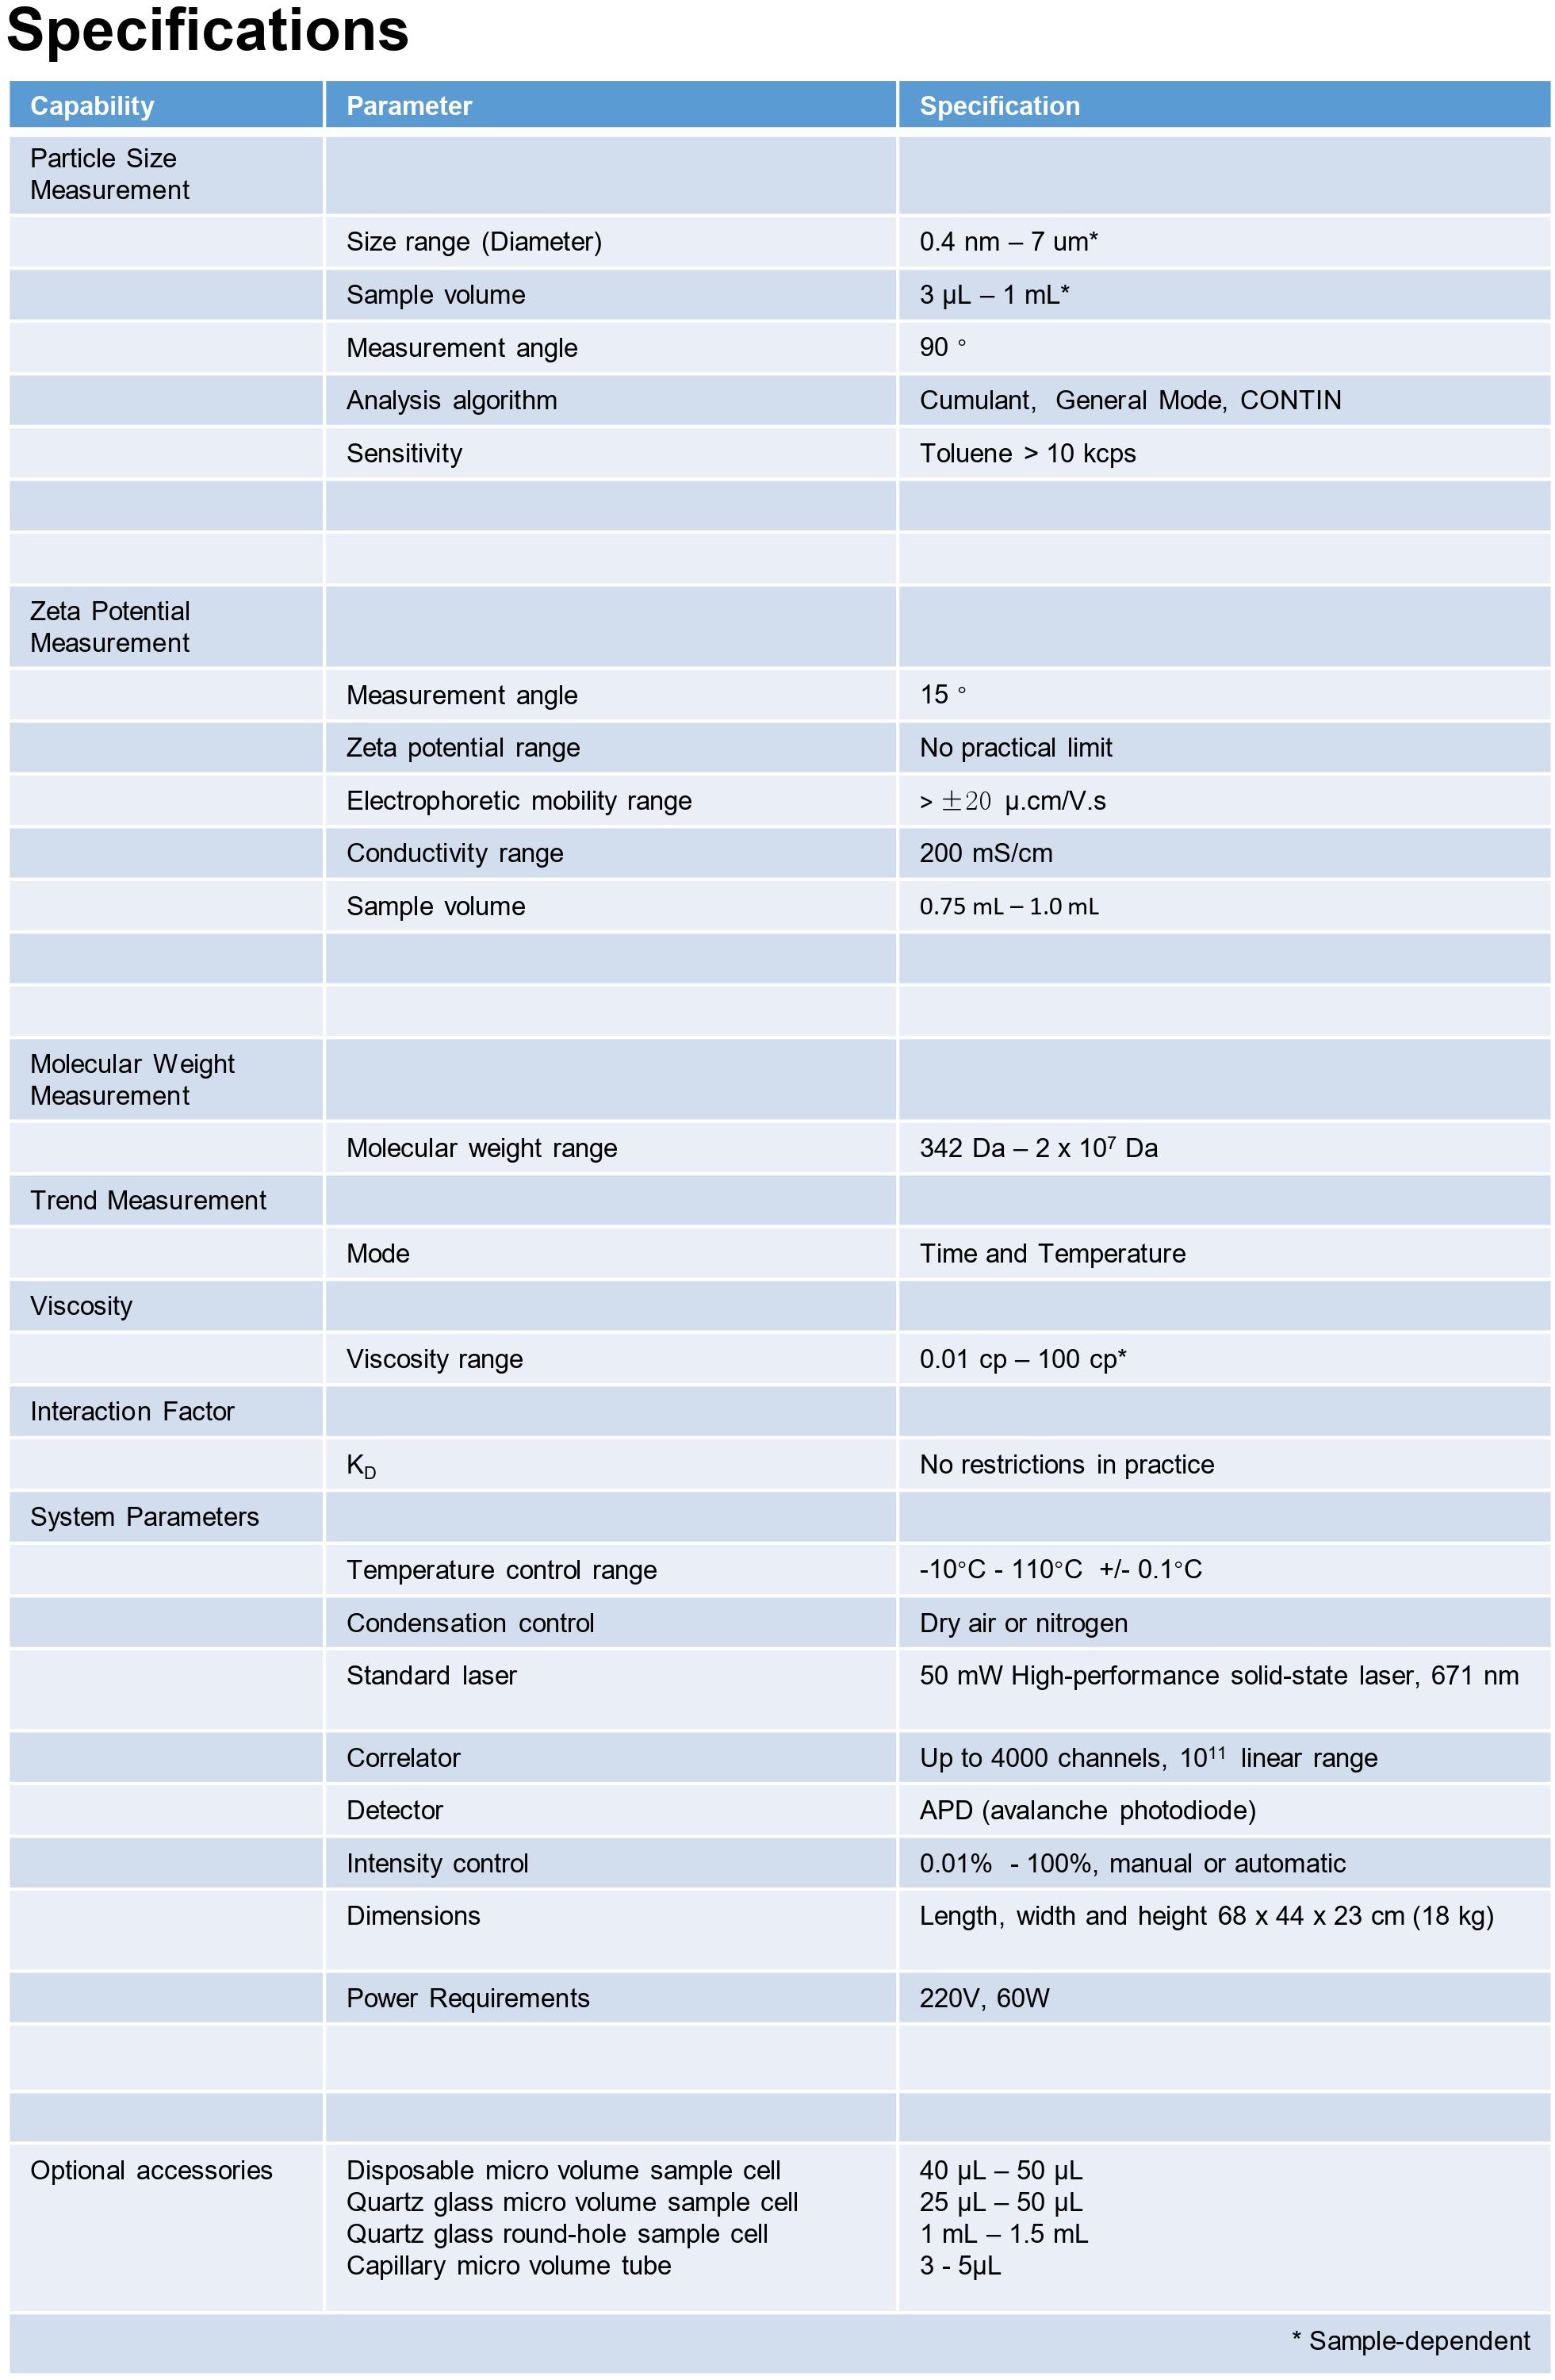
• Size test range :0.4-7000nm
• Electric displacement test range: -500mV ~ 500mV
• Molecular weight test range :342Da -- 2X10 ^7Da
• Electric displacement test range: -500mV ~ 500mV
• Molecular weight test range :342Da -- 2X10 ^7Da
Model :
90 Zeta
1.90Zeta electric displacement measurement Using the principle of electrophoretic light scattering (ELS), the Zeta potential is obtained by measuring the motion velocity of particles in the electric field. Generally speaking, the higher the Zeta potential is, the more intense the mutual repulsion between particles is, and the more stable the dispersion system is.
2. Nano particle size distribution measurement by using dynamic light scattering (DLS) principle of Brownian motion particles in suspension, smaller particles move faster than larger particles, testing record scattering intensity in a certain Angle, the scattering intensity correlation curve reflects the particle movement speed, the information can be used to calculate the particle size.
3. Molecular weight measurement adopts the principle of static light scattering (SLS), and the intensity of scattered light is directly related to molecular weight. The molecular weight of the sample can be obtained by measuring the scattered light intensity in different concentrations and drawing Debye curve.
Rapid measurement ability: fast measurement speed; All test results can be edited later.
Laser system: high power, good stability, long life
Laser system: high power, good stability, long life
Optical fiber detection system: high sensitivity, effectively improve the signal noise ratio
Sample Temperature Range: From -10°C... 110 ° c.1.Dynamic Light Scattering
Dynamic light scattering (DLS), also known as photon correlation spectroscopy (PCS) or quasi-elastic light scattering (QELS), is a technology used to detect the fluctuations of the scattering intensities caused by the Brownian motion of particles.
In the dispersant, smaller particles move faster, while larger particles move slower. An avalanche photodiode (APD) detector aligned at 90°collects the scattering intensities of the particles and records them with time. The time-dependent fluctuation is converted into a correlation function using the correlator. By applying a mathematic algorithm, the diffusion coefficient D is thereby obtained. The hydrodynamic diameter D H and its distribution are calculated through the Stokes-Einstein equation.
2.Electrophoretic Light Scattering
Particles usually carry charges on the surface in aqueous systems, surrounded by counter-ions that form a firmly inner Stern layer and an outer shear layer. Zeta potential is the electrical potential at the interface of the shear layer. Suspension systems with higher zeta potentials tend to be more stable and less likely to form aggregates.
Electrophoretic light scattering (ELS) is a technology for measuring electrophoretic mobility via Doppler shifts of the scattered light. When an incident light illuminates dispersed particles that are subjected to an applied electric field, the frequency of the particles’ scattered light will be different from the incident light due to the Doppler effect. The frequency shift is measured and converted to provide the electrophoretic mobility and hence the zeta potential of a sample by Henry’s equation.
3.Static Light Scattering
Static light scattering (SLS) is a technology which measures the scattering intensities of the sample, weight-average molecular weight (Mw) and second virial coefficient A2 through Rayleigh equation:
where C is the sample concentration, θ is the detection angle, Rθ is the Rayleigh ratio used to characterize the intensity ratio between the scattered light and the incident light at angle θ, Mw is the sample’s weight-average molecular weight, A2 is the second virial coefficient, and K is a constant related to (dn/dc)2.
During molecular weight measurements, scattering intensities of the sample at different concentrations are detected. By using the scattering intensity and Rayleigh ratio of a known standard (such as toluene), the Rayleigh ratios of samples at different concentrations are computed and plotted into a Debye plot. The molecular weight and the second virial coefficient are then obtained through the intercept and slope from the linear regression of the Debye plot.